
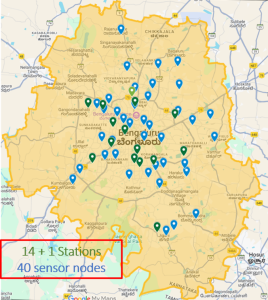
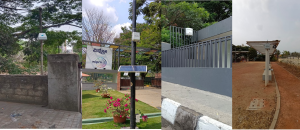
In recent days, air quality assessments using hybrid methods, deploying a combination of reference-grade Continuous Ambient Air Quality Monitoring Stations (CAAQMS), satellite-based monitoring and sensor-based monitoring, have tremendously increased in various parts of the world. However, most hybrid air sensor networks only focus on particulate measurements. Hence, we deployed 40 sensor nodes in the Bengaluru urban region (Figure 1) to monitor particulate matter (PM2.5, PM10) and various gas pollutants (O3, NO2, and CO) at high spatial (~4x more nodes than the government reference network) and temporal (~minutes) resolution. The main goal of this study is to develop spatial maps of various air pollutants by using observations from a hybrid air sensor network combined with land-use regression (LUR) models, which can then be used to estimate population exposure. The sensors were deployed in 40 locations across the study region at the human breathing height (2-5m from the ground level) (Figure 2), with sites selected based on satellite estimates of surface air pollution, land-use attributes, and identification of various point-of-interest areas. The sensor network has been operational since July 2024.
Airnet is a web-based application that provides access to a Data Management System developed by CSTEP to collate and store low-cost sensor data in near-real-time. The application enables users to view pollutant concentrations for each sensor across different sites, download location-specific data in .xlsx format and monitor the health of the sensors. Airnet sources its data from an automated data pipeline that fetches raw data from multiple integrators, standardises it, and applies corrections using locally developed calibration models, ensuring accuracy and reliability. The web application is designed for a range of users, including, but not limited to, policymakers, academics, sensor hosts, and developers. It offers tailored user interfaces based on specific user roles and profiles.